Data Vis - Design
Intro/Extro
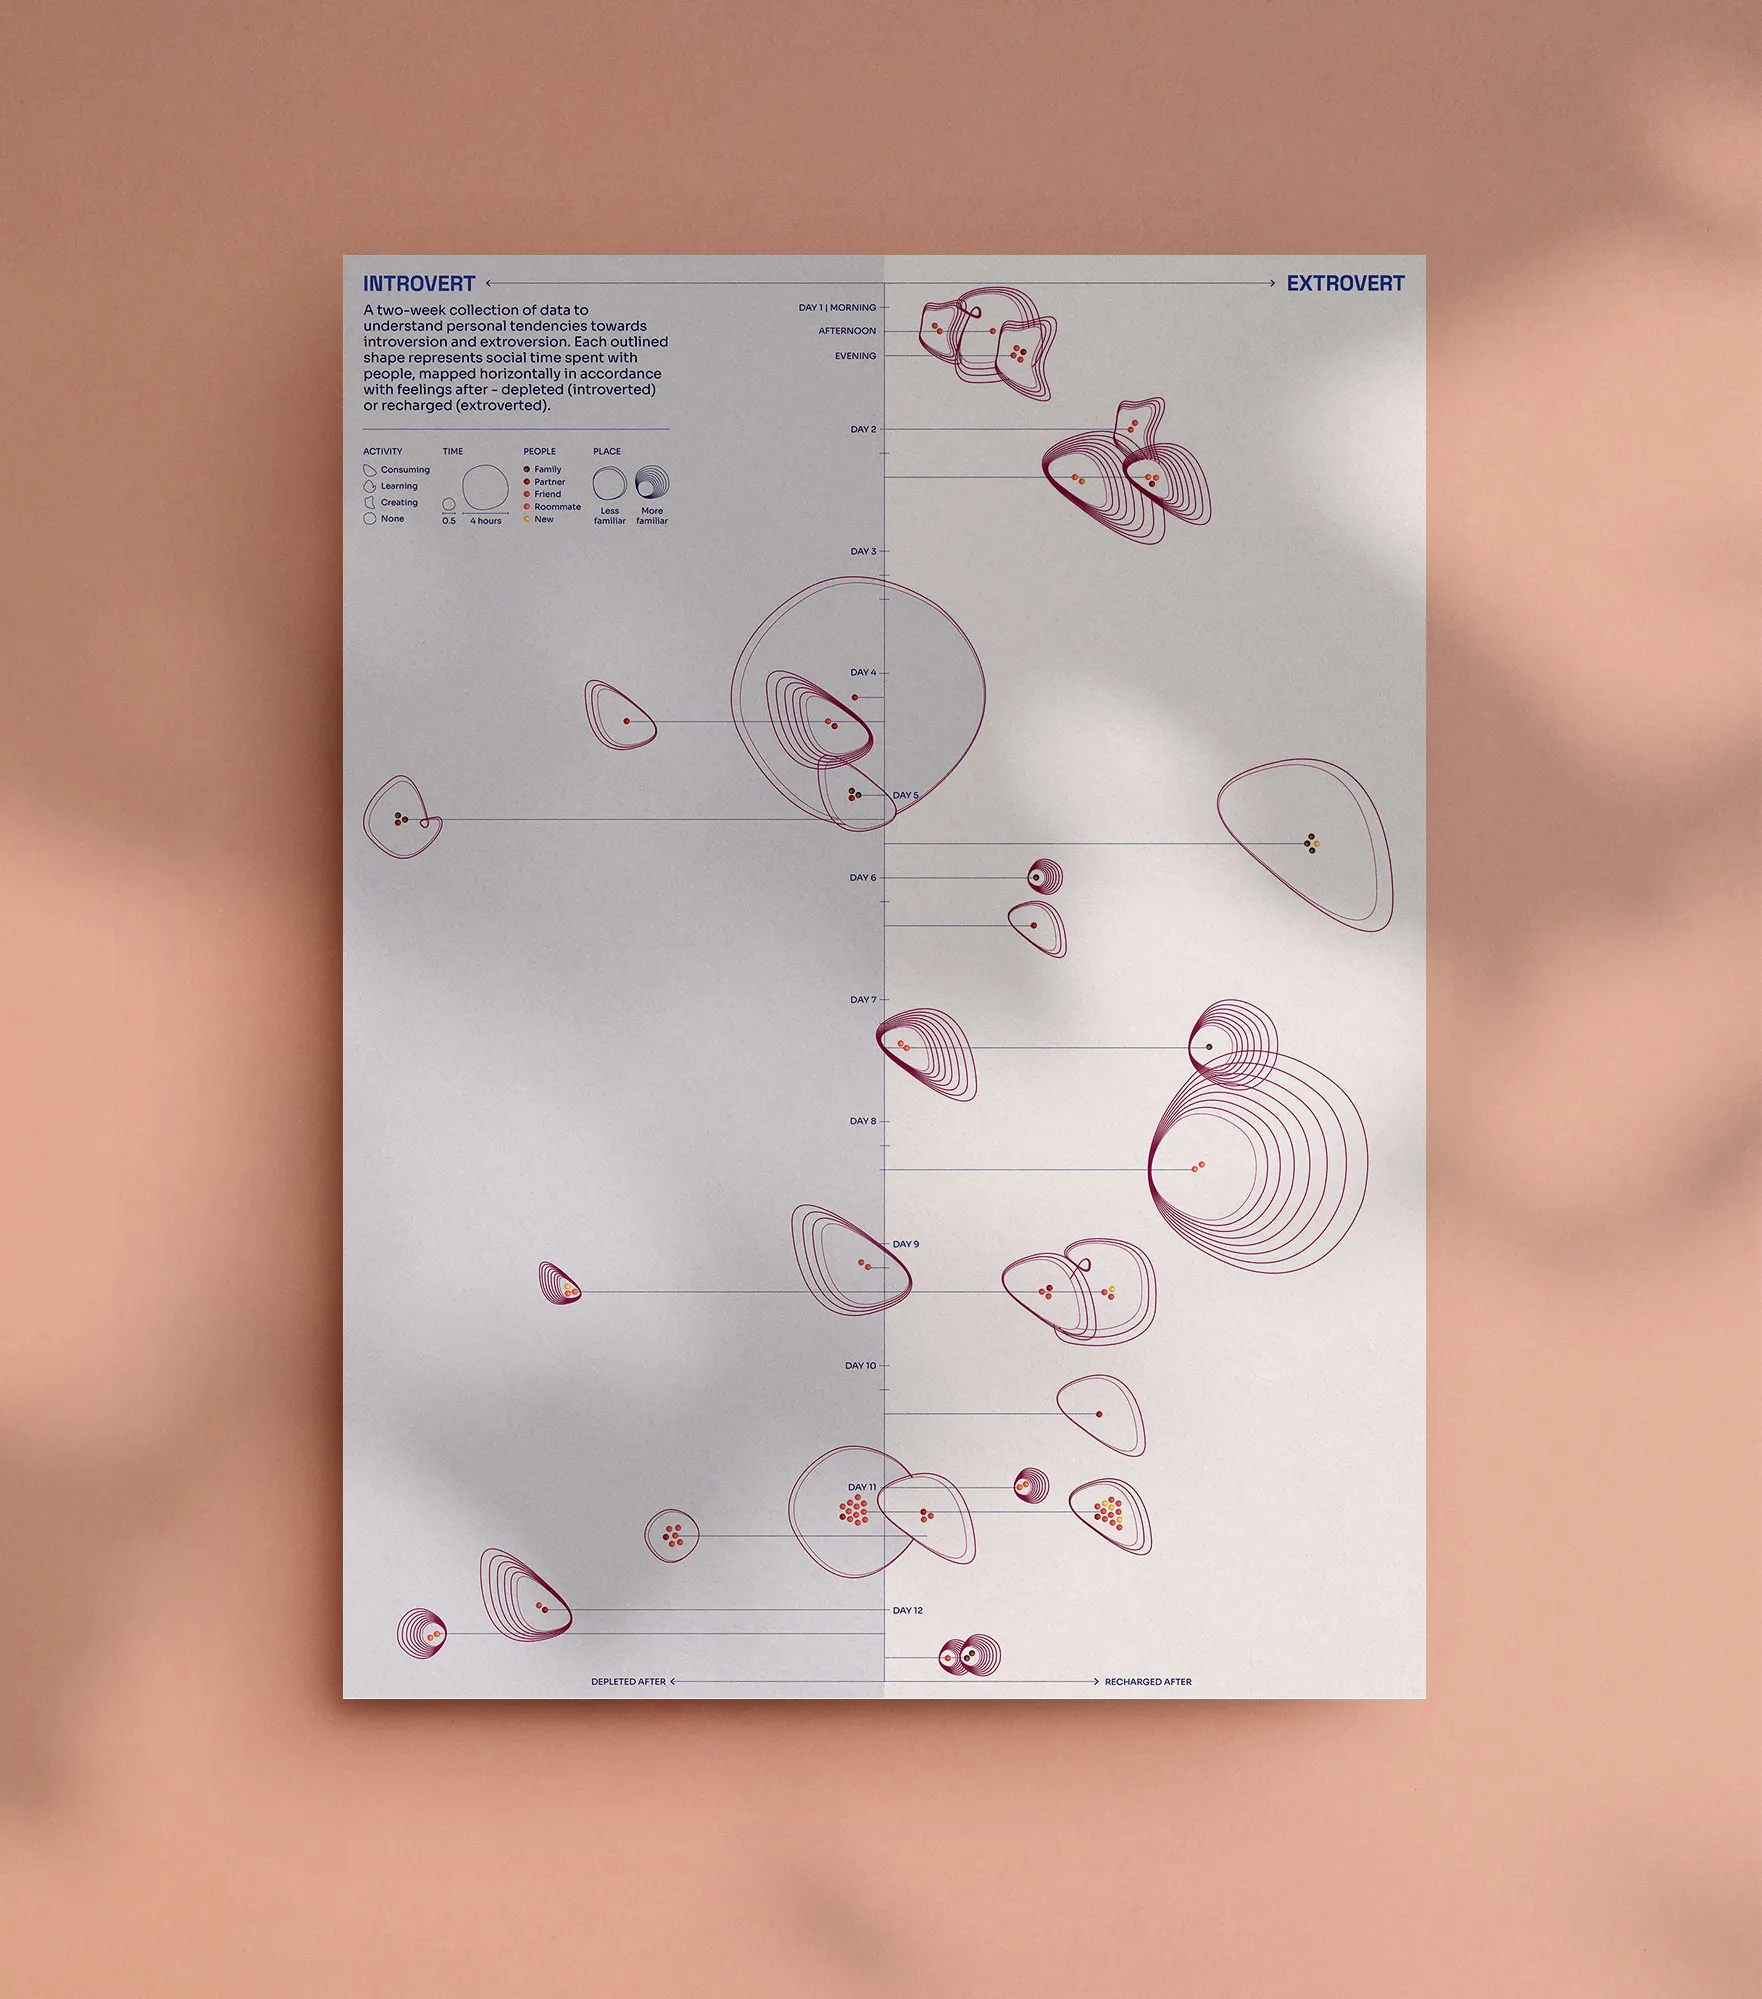
A poster and hand-drawn postcard to visualize personal data around social time collected over the course of two weeks.
- When
- Feb 2026
- Where
- Parsons School of Design
Goal
Inspired by Giorgia Lupi and Stefanie Posavec's Dear Data project, collect data surrounding daily routine and understand personal experience from a new perspective by sketching it on a small postcard. After gaining initial insights and feedback, translate the visualization to a printed poster to explore a new aspect of the data.
Data collection
Over the course of two weeks, I tracked 30 social interactions, with 10 columns each. As someone who would usually categorize myself as an introvert but often feels bursts of characteristics of extroversion, I wanted to see if intentionally collecting data on many factors that make up my social time could help me discover patterns in what leads me to gravitate more towards feeling drained or recharged by spending time with people.

Postcard
Following the project that inspired this work, I interpreted my data by creating a 3" x 5" hand-drawn postcard, attempting to visually encode the many factors about each social interaction's data. Since the data was so personal, I leaned in to visually representing each attribute according to more abstract emotional interpretation - encoding colors and shapes based on the energy behind relationships and activities.
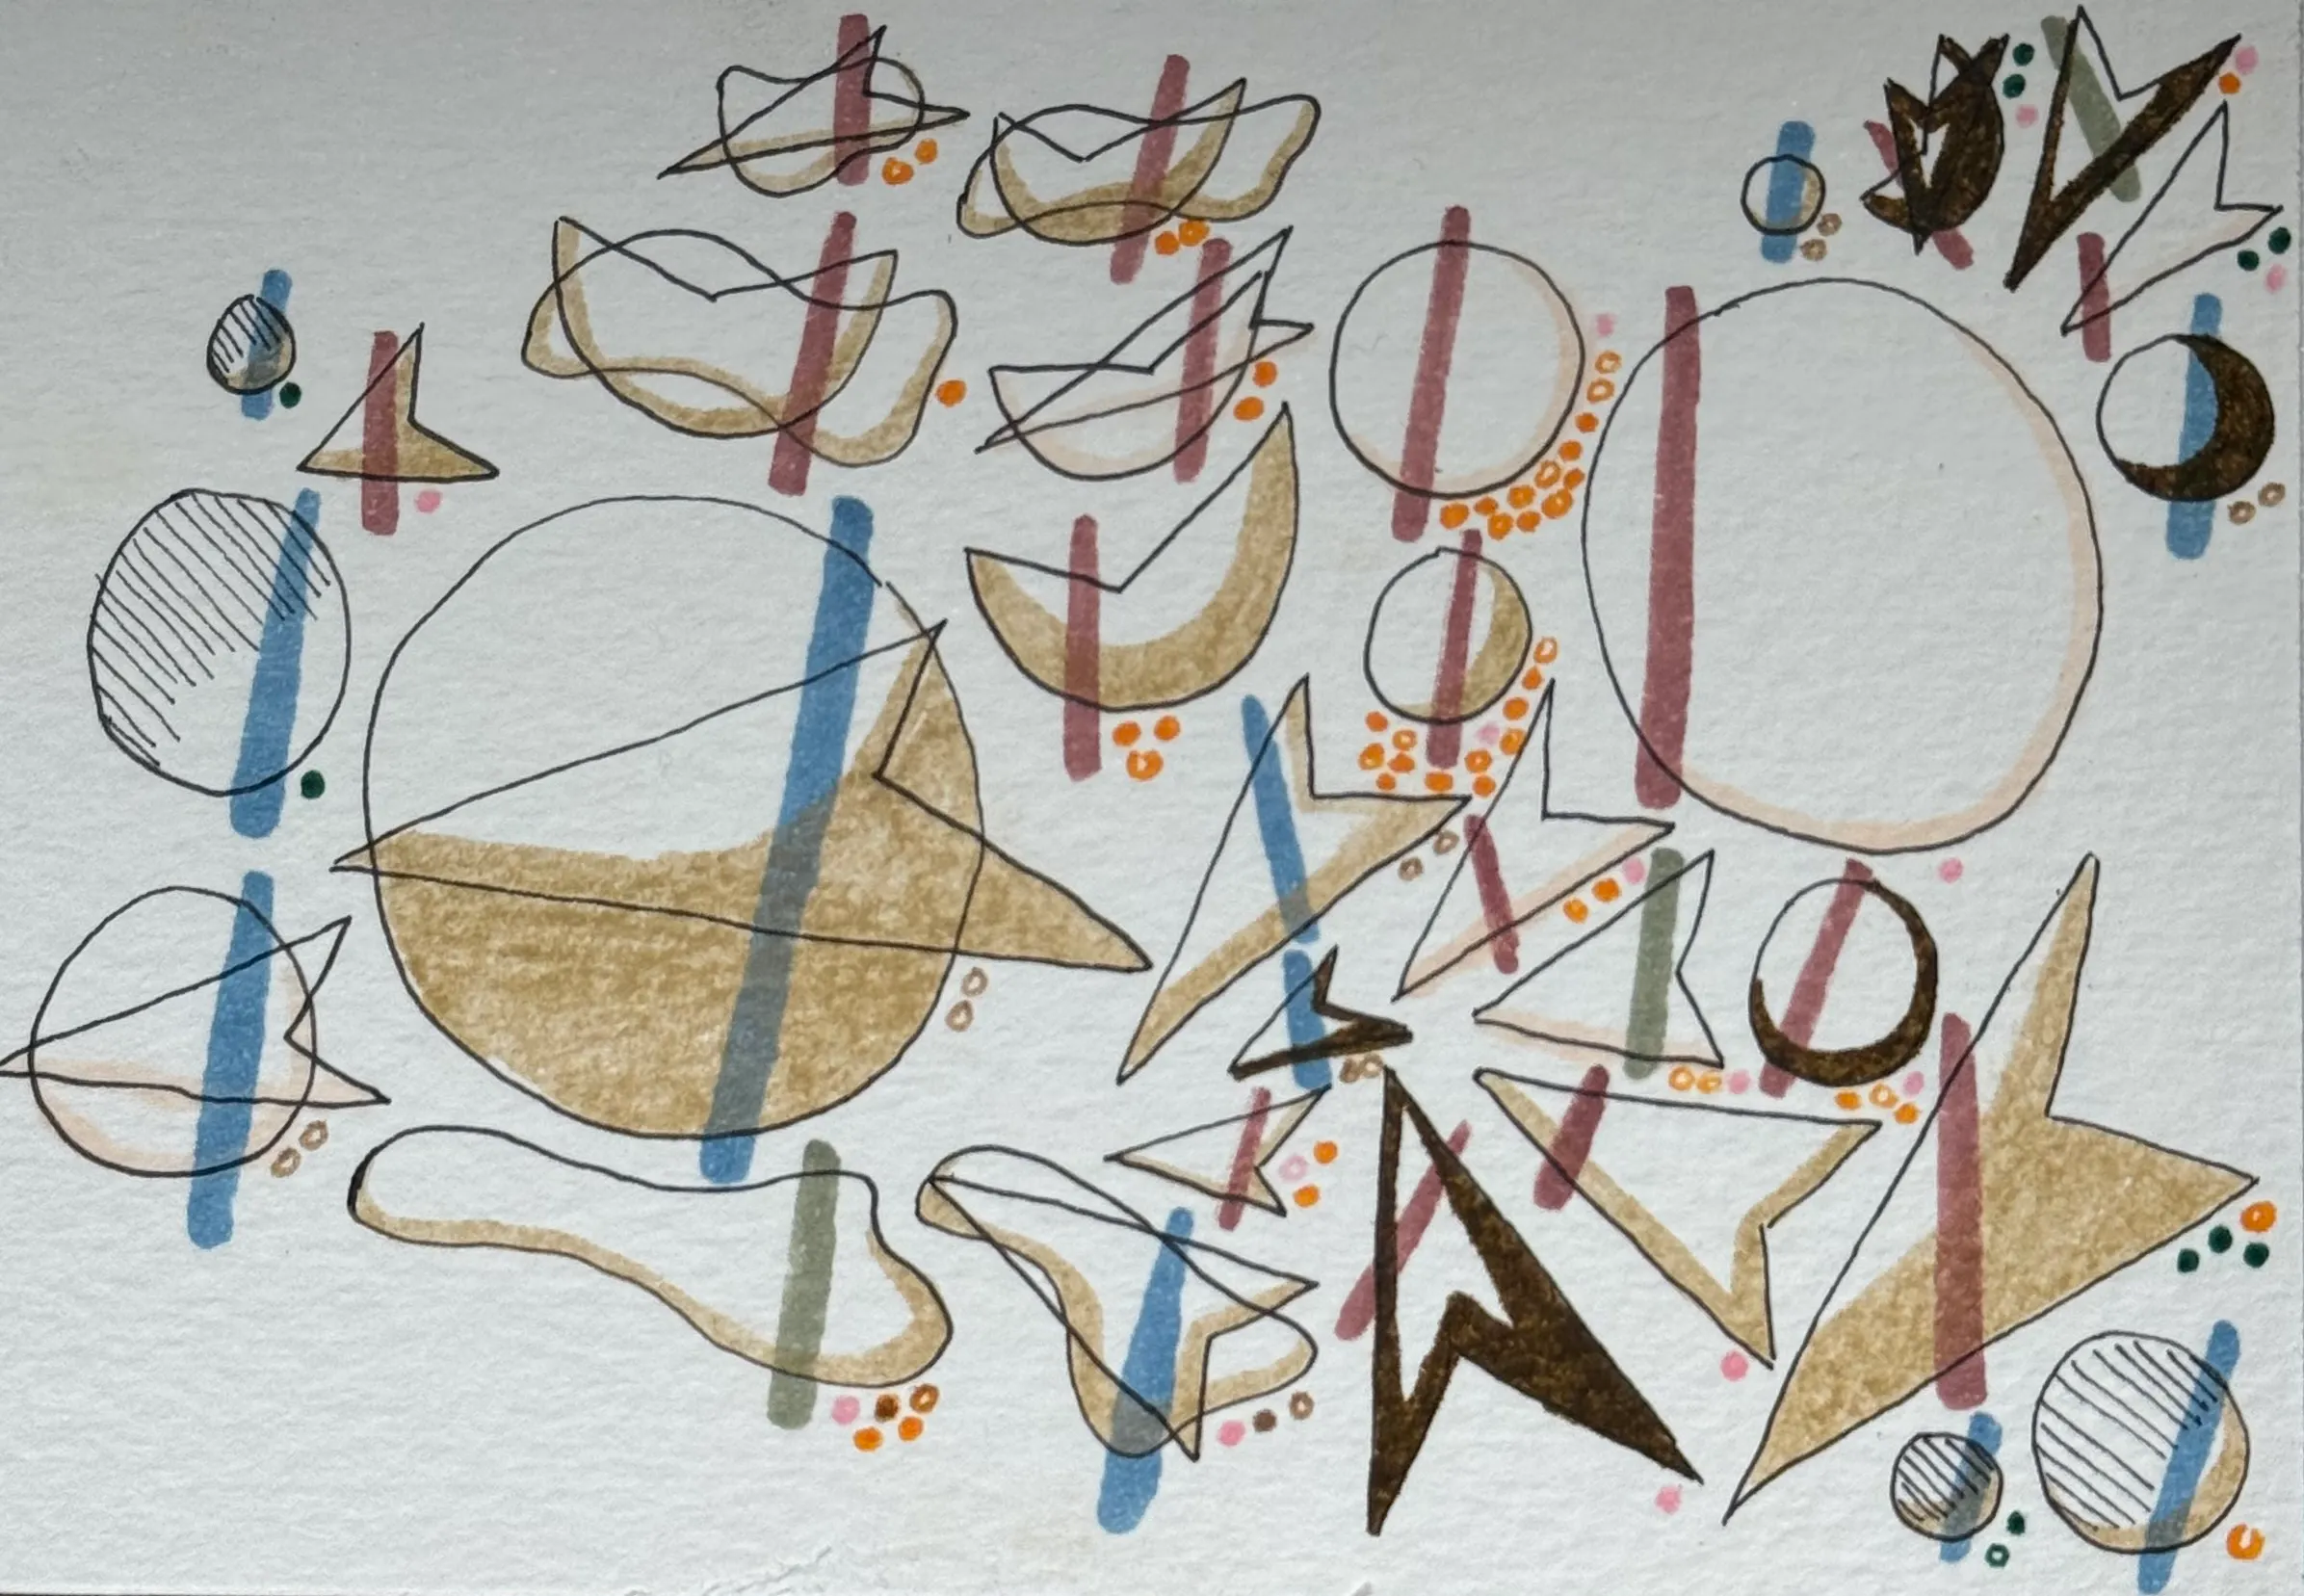
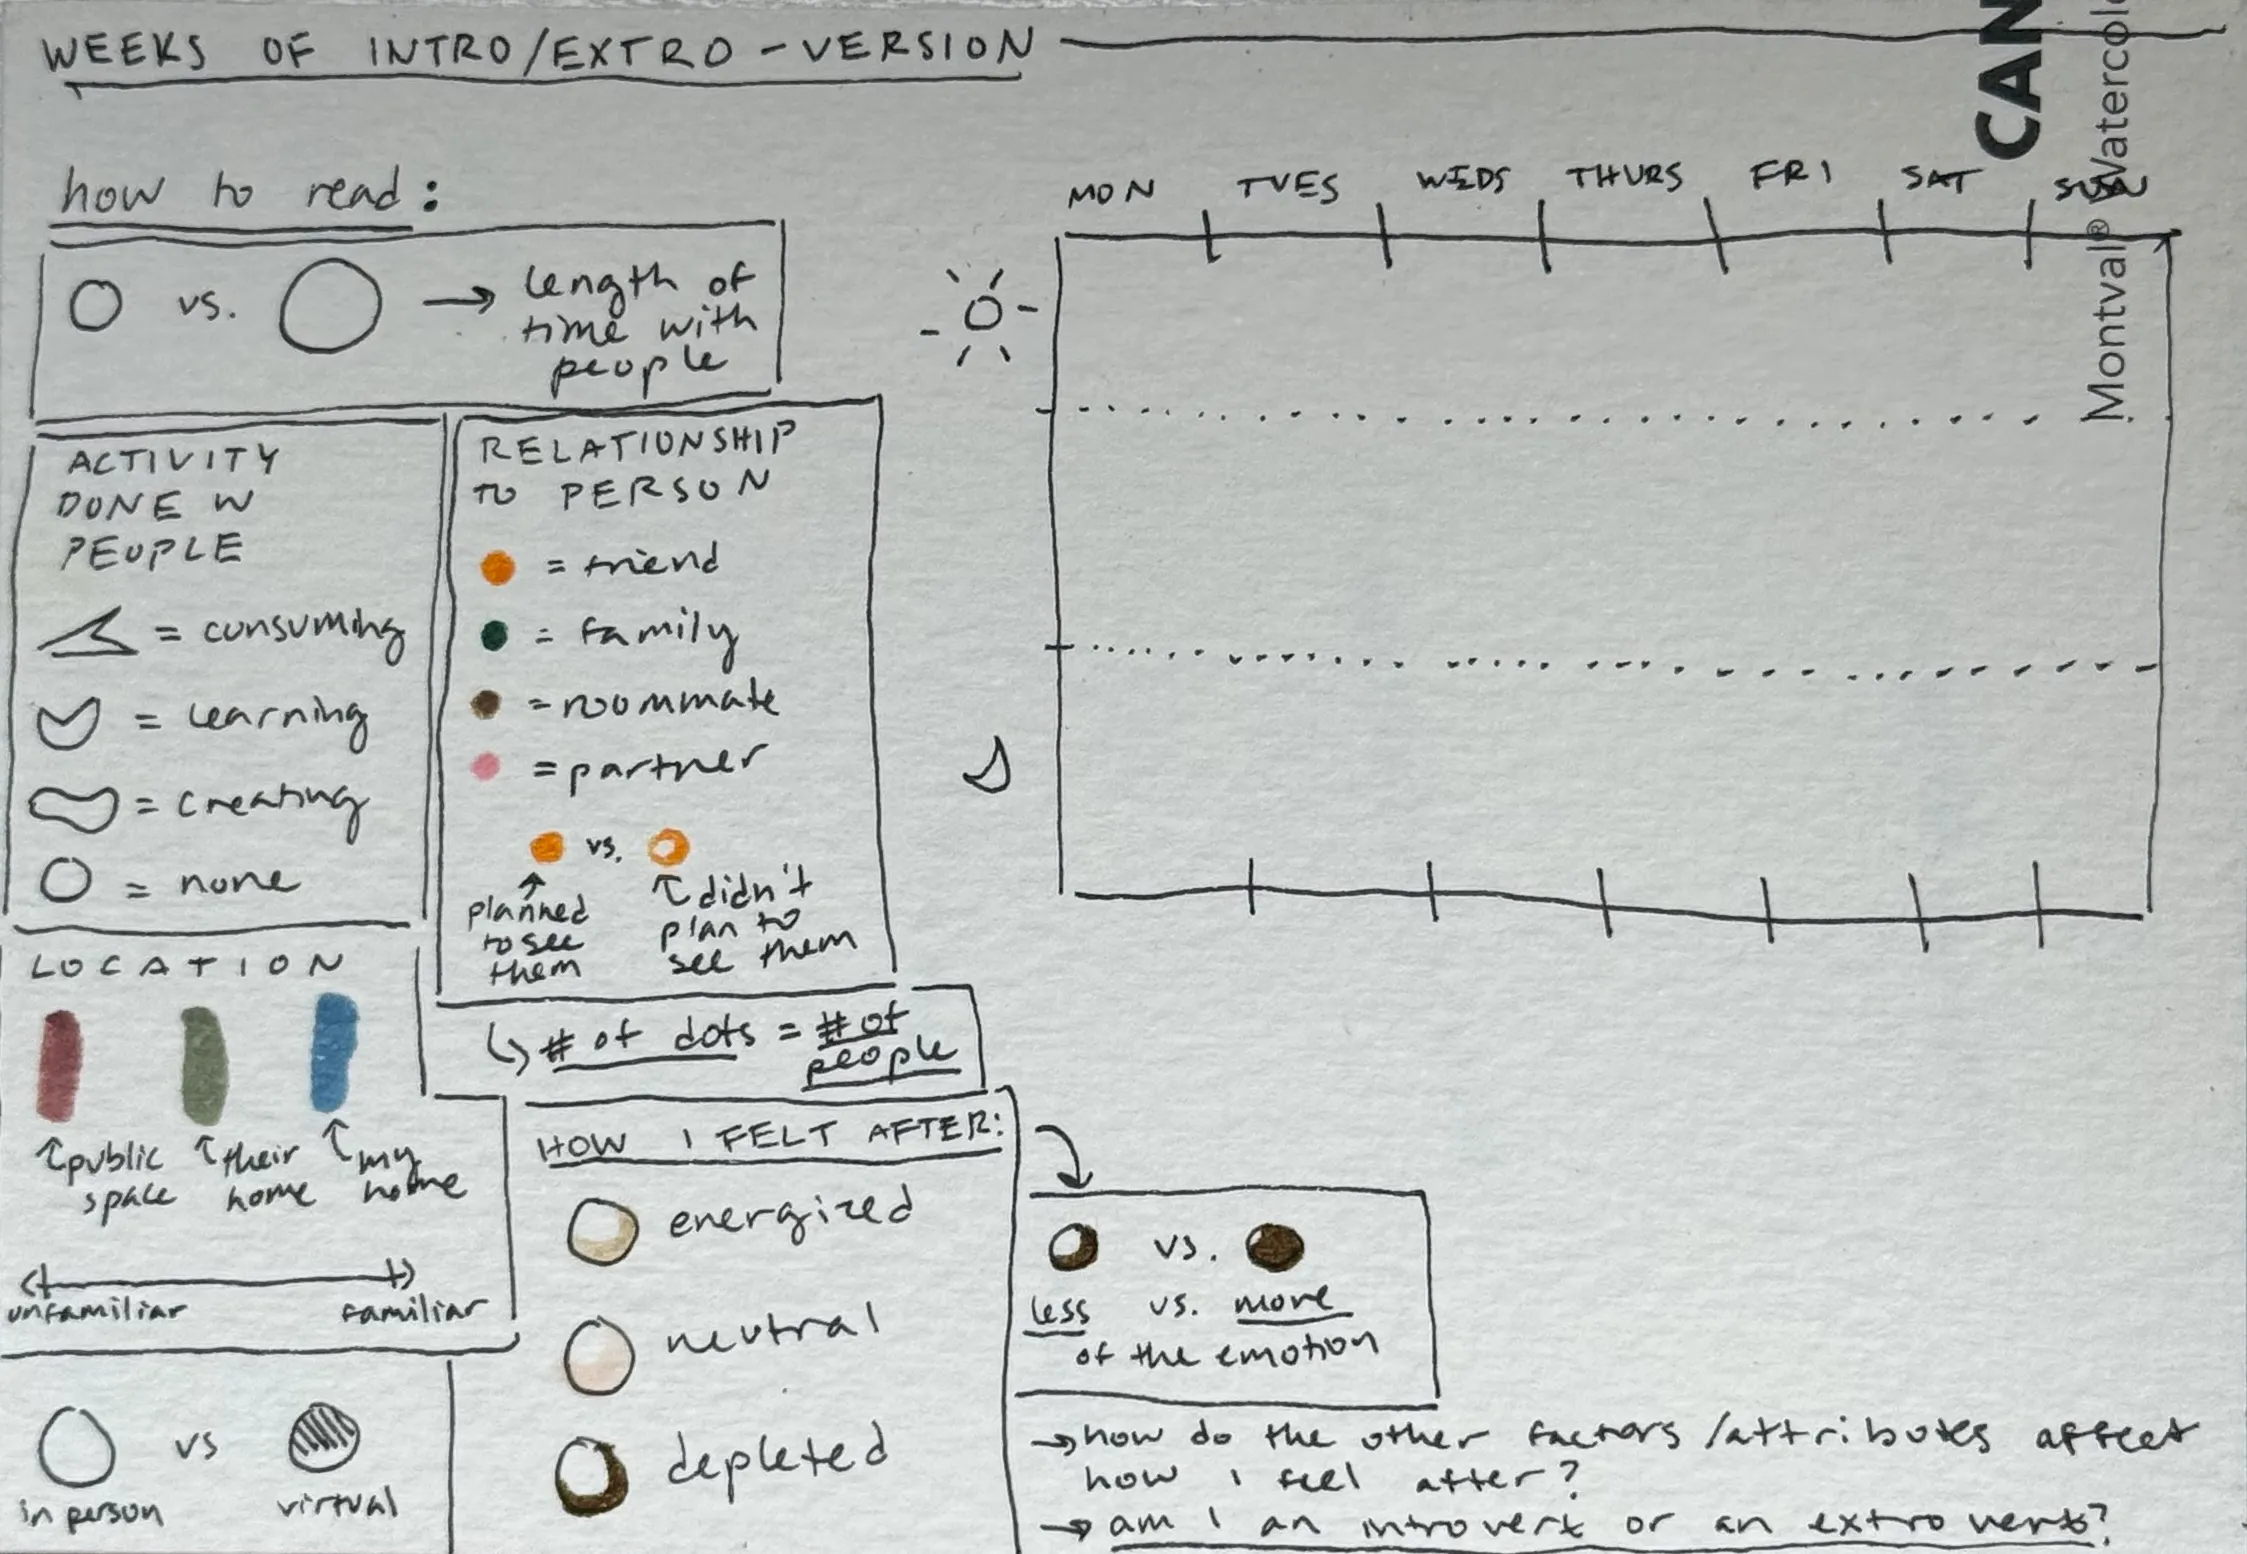
Poster
In translating my small postcard to a large-scale (18" x 24") poster, I focused on why I had initially collected this data and let the "feelings after" column dictate the poster layout.
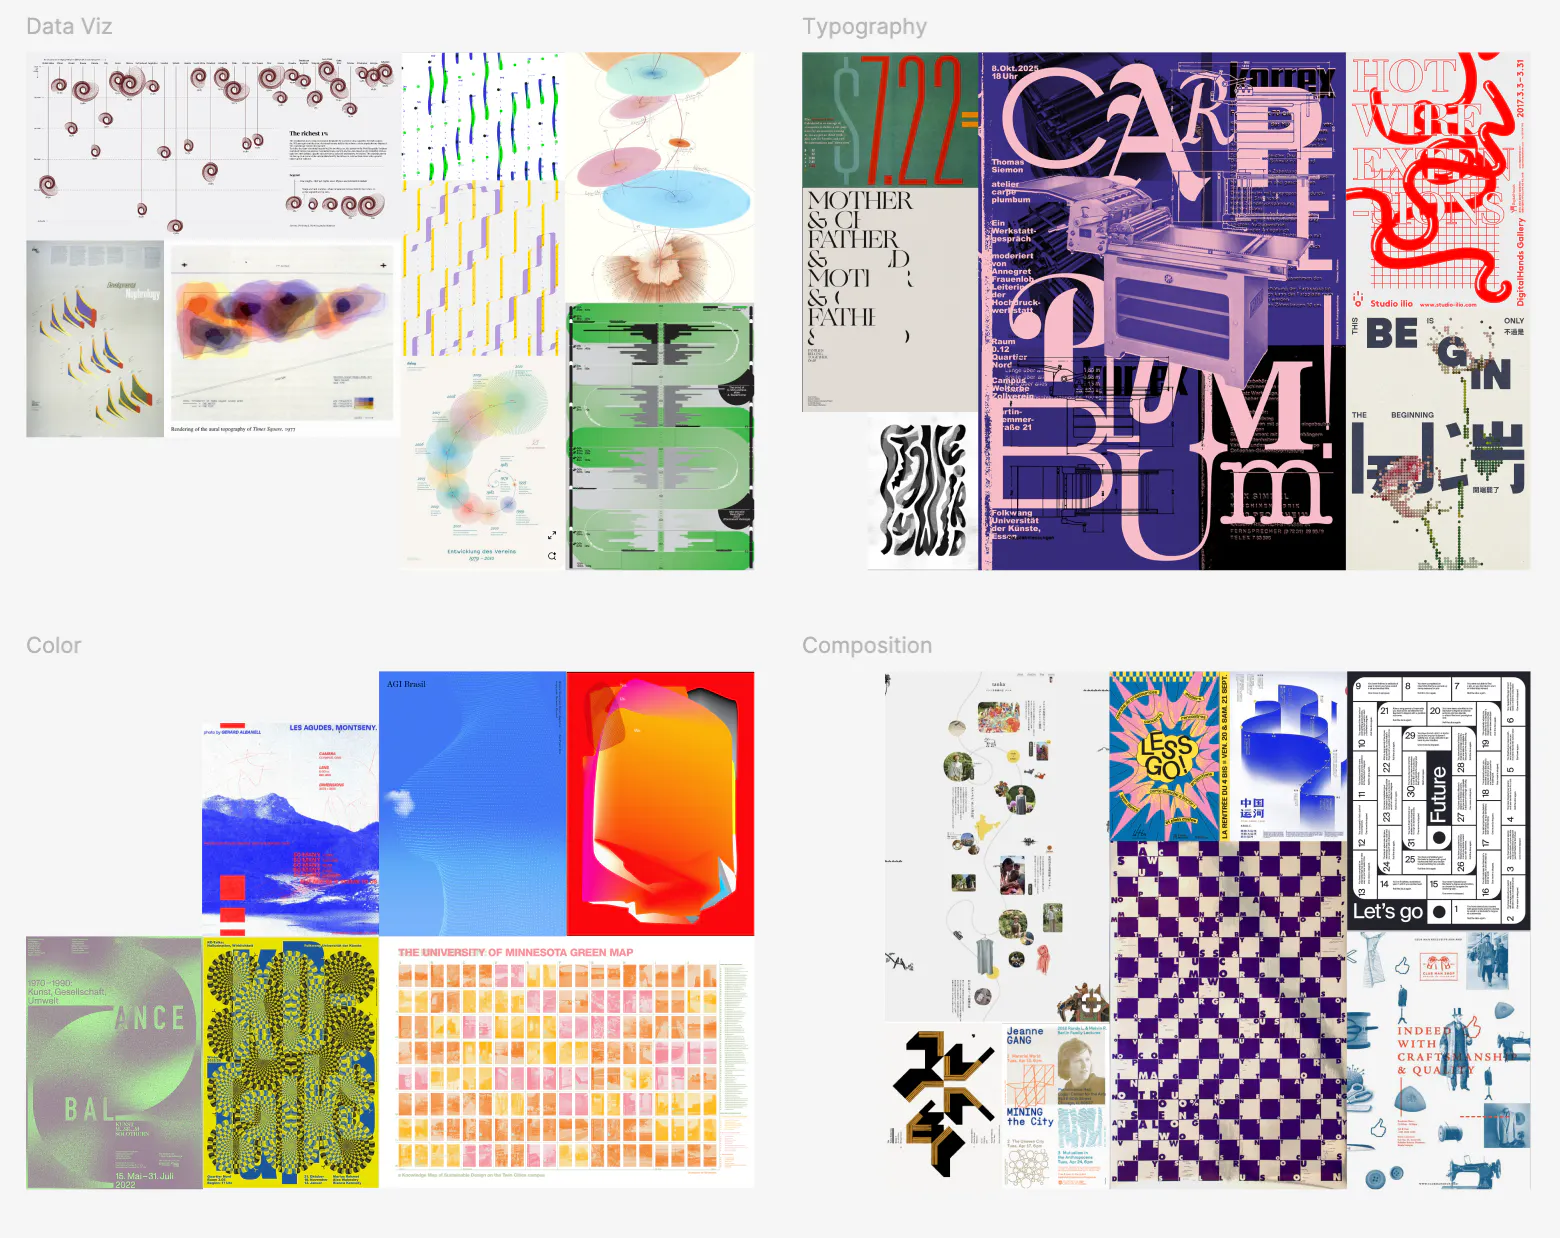
I gathered references surrounding formal elements like color, composition, and type to inspire how I might translate this poster and explore different visual approaches.
I created visual encodings for the rest of the columns that I deemed necessary for understanding trends, and laid each data point out using area to answer my original question.
After an initial round of printing and feedback, I re-examined which of my visual encodings were successful and which were in conflict. The final poster translates this personal data into a layered print visualization, capturing the emotion behind the initial question: am I an introvert or an extrovert?